Introduction: Why Salesforce Training Needs to Be Measured, Not Just Managed
Every year, organizations worldwide invest billions of dollars in enterprise software training, and Salesforce sits at the top of that list. As the world’s leading CRM platform, Salesforce powers sales pipelines, customer service operations, marketing campaigns, and business analytics for companies of every size and industry. When organizations implement Salesforce or roll out new features, they invest heavily in training their teams — and rightfully so.
But here is the critical question that far too many companies fail to answer: How do you actually know if your Salesforce training is working?
Many training managers can confidently report how many employees completed a course. Some can share certification numbers. Fewer can tell you whether those trained employees are actually using Salesforce more effectively, closing more deals, resolving cases faster, or generating a measurable return on the training investment.
This gap between training delivery and proven business impact is exactly why Salesforce training effectiveness metrics have become essential for modern learning and development strategies. Without the right measurement framework, organizations are essentially investing in training on faith rather than evidence.
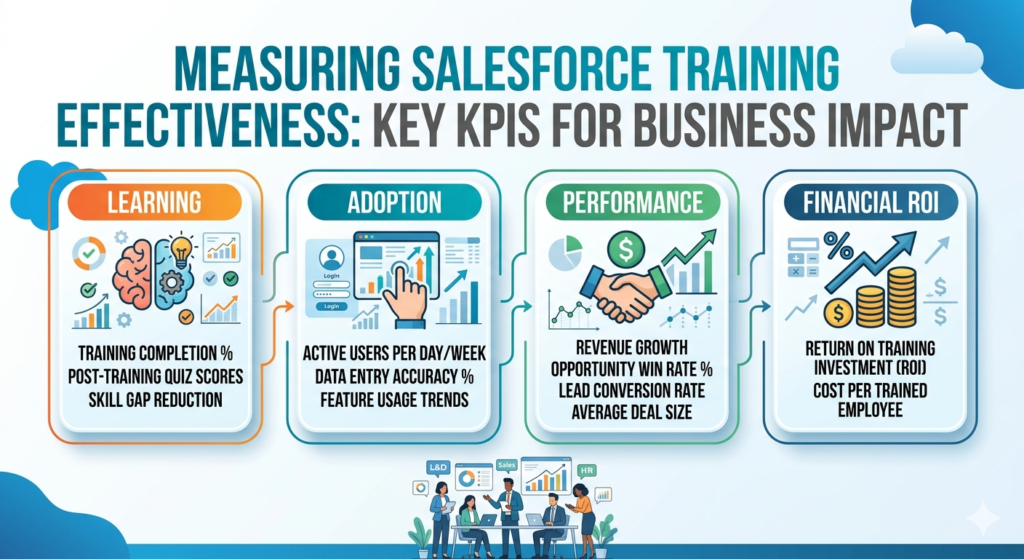
This blog post provides a complete, practical guide to the most important Salesforce training KPIs across four levels — learning, adoption, performance, and financial ROI. Whether you are a corporate L&D team, a Salesforce Center of Excellence leader, an HR enablement manager, or a business transformation executive, this guide will show you exactly how to measuring Salesforce training in a way that connects directly to business outcomes and justifies every dollar spent.
Why Measuring Salesforce Training Matters: The Business Case for Metrics
Before diving into specific KPIs, it is worth understanding why measurement itself is so strategically important. Here are the four core reasons that measuring Salesforce training ROI and outcomes should be a non-negotiable priority:
1. Justifying Training Budgets to Leadership
Training programs without measurable outcomes are the first to be cut during budget reviews. When L&D leaders can present concrete data showing that Salesforce training reduced onboarding time by 30%, increased sales productivity by 20%, or reduced IT support tickets by 40%, they transform training from a perceived cost center into a proven business investment. Employee training metrics give executives the language they need to see L&D as strategic, not administrative.
2. Identifying Skill Gaps and Adoption Challenges
Measuring training effectiveness reveals where learning is working and where it is not. If assessment scores are high but Salesforce adoption metrics show low dashboard usage, the problem may not be knowledge retention — it may be workflow integration or change management. Metrics tell you where to focus your improvement efforts with precision rather than guesswork.
3. Improving Future Training Programs
Data-driven training programs get better over time. When you track which modules produce the highest proficiency scores, which delivery formats drive the best adoption, and which topics correlate most strongly with performance improvement, you can continuously refine your learning and development Salesforce strategy to maximize impact.
4. Linking Training Outcomes to Business KPIs
Perhaps most importantly, measurement creates a visible connection between training activities and business results. This alignment ensures that Salesforce training programs are always designed with strategic outcomes in mind — not just knowledge transfer for its own sake.
Level 1: Learning Metrics — Did Participants Actually Learn?
The first layer of Salesforce training effectiveness metrics focuses on the learning experience itself. These foundational KPIs answer the most basic question: Did your training participants gain the knowledge and skills the program was designed to deliver?
Course Completion Rate
What it measures: The percentage of enrolled learners who complete a Salesforce training course or learning path from start to finish.
Why it matters: A low completion rate signals disengagement, scheduling conflicts, irrelevant content, or poor user experience. While completion alone does not guarantee learning, it is a prerequisite for all downstream outcomes.
Benchmark target: Industry-leading corporate training programs aim for completion rates of 85% or higher for mandatory Salesforce training.
How to track it: Most LMS platforms and Salesforce Trailhead track completion rates automatically. Segment the data by department, role, and training format to identify patterns.
Assessment Scores
What it measures: Learner performance on quizzes, knowledge checks, and formal assessments administered during or after Salesforce training.
Why it matters: Assessment scores move beyond attendance to measure actual knowledge acquisition. A learner who completes a course with a 95% assessment score is demonstrably better prepared than one who scores 55%.
Benchmark target: Aim for average post-training assessment scores of 80% or higher across your Salesforce training cohorts.
How to track it: Build pre-training and post-training assessments into every course to measure knowledge gain, not just final scores.
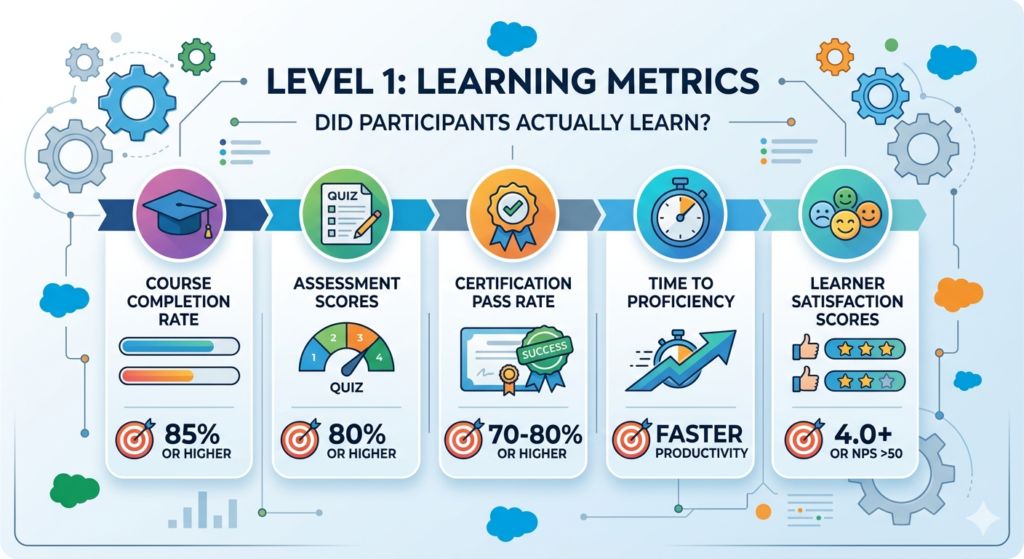
Certification Pass Rate
What it measures: The percentage of employees who pass Salesforce certifications such as Salesforce Administrator, Sales Cloud Consultant, or Service Cloud Consultant on the first attempt.
Why it matters: Salesforce certifications are externally validated proof of competency. A high first-attempt pass rate indicates that your training program is effectively preparing employees for real-world Salesforce usage. This is one of the most credible Salesforce adoption KPIs you can present to senior leadership.
Benchmark target: Organizations with strong training programs achieve first-attempt certification pass rates of 70-80% or higher.
How to track it: Track certification attempts through Salesforce’s certification management system and correlate pass rates with specific training programs or instructors.
Time to Proficiency
What it measures: The time it takes for a newly trained employee to reach a defined level of independent, competent Salesforce usage following training completion.
Why it matters: Shorter time to proficiency means faster productivity, lower supervision costs, and quicker business impact. This metric directly connects training program design to operational efficiency.
Benchmark target: Establish role-specific proficiency benchmarks. For example, a new sales rep might be expected to manage their pipeline independently in Salesforce within two weeks of onboarding training.
How to track it: Define clear proficiency milestones, observe performance milestones in Salesforce activity reports, and combine with manager assessments.
Learner Satisfaction Scores
What it measures: How satisfied participants are with the Salesforce training experience, typically gathered through post-course surveys using Net Promoter Score (NPS) methodology or Likert scale ratings.
Why it matters: Satisfaction scores reflect the perceived relevance, quality, and applicability of training content. High satisfaction correlates with higher motivation to apply learning on the job. This is a critical component of the classic Kirkpatrick Level 1 evaluation model.
Benchmark target: Target learner satisfaction scores of 4.0 or higher on a 5-point scale, or NPS scores above 50.
How to track it: Deploy automated post-training surveys through your LMS or tools like SurveyMonkey, Typeform, or Salesforce Feedback Management.
Level 2: Adoption Metrics — Are Employees Actually Using Salesforce?
Learning metrics tell you what happened in the classroom or digital learning environment. Adoption metrics tell you what is happening in Salesforce itself. These Salesforce user adoption metrics are where training impact becomes visible in real operational data.
Login Frequency
What it measures: How often trained users log into Salesforce on a daily, weekly, and monthly basis following training completion.
Why it matters: If users are not logging into Salesforce regularly, everything that was learned in training is being wasted. Login frequency is the most basic indicator of whether training created behavioral change.
How to track it: Salesforce provides built-in login history reports. Navigate to Setup → Login History, or build a custom report tracking user login frequency by role, team, or training cohort.
Record Creation and Updates
What it measures: The volume and accuracy of records — leads, contacts, opportunities, cases, accounts — being created and updated by trained users.
Why it matters: Salesforce’s value depends entirely on data quality and completeness. Trained users should create more records, update them more frequently, and do so with greater accuracy than untrained users.
How to track it: Use Salesforce reports to compare record creation volume and update frequency before and after training by user group. Monitor field completion rates to assess data quality improvement.
Dashboard Usage
What it measures: The frequency with which users access Salesforce reports and dashboards to inform their decisions.
Why it matters: One of the most transformative aspects of Salesforce training is teaching users to leverage data for decision-making rather than operating on intuition. If dashboard views are not increasing after training, users are missing a core value driver of the platform.
How to track it: Salesforce tracks report and dashboard run history. Create a report on report runs filtered by user group and compare pre- and post-training activity.
Automation Adoption
What it measures: The extent to which trained users are leveraging Salesforce automation features such as workflows, flows, approval processes, and automated email templates.
Why it matters: Automation adoption is a strong indicator of advanced Salesforce proficiency. Users who automate repetitive tasks are more productive and extract significantly more value from the platform.
How to track it: Monitor flow execution logs, workflow trigger histories, and email template usage rates. Track the number of automations deployed by department over time.
Reduction in Data Entry Errors
What it measures: The decrease in data quality issues such as duplicate records, missing required fields, invalid formats, and data inconsistencies following Salesforce training.
Why it matters: Poor data quality is one of the most common and costly consequences of inadequate Salesforce training. Measuring error reduction directly connects training to data governance and operational efficiency outcomes.
How to track it: Use Salesforce duplicate management reports, validation rule logs, and data quality tools like Cloudingo or DemandTools to track error rates over time.
The Role of Salesforce Reports and Dashboards in Tracking Adoption
It is worth emphasizing that Salesforce itself is one of the most powerful tools you have for measuring adoption. You do not need expensive third-party tools to understand how your trained users are interacting with the platform. Build a dedicated Salesforce training effectiveness dashboard that includes login trends, record activity, report usage, and automation metrics, segmented by training cohort. Share this dashboard with your L&D team and Salesforce admins weekly to track adoption in real time.
Level 3: Performance Metrics — Is Training Improving Business Outcomes?
This is where corporate Salesforce training outcomes become strategically significant. Level 3 metrics connect training activity to the operational and commercial performance indicators that senior leadership cares about most.
Sales Productivity
What it measures: Output per sales representative — measured as revenue generated, opportunities closed, or activities completed — relative to time invested.
Why it matters: Salesforce is a sales productivity tool at its core. If sales training on Salesforce is working, sales reps should be closing more deals, managing larger pipelines, and spending less time on administrative tasks.
How to track it: Compare average revenue per rep, activities per rep per week, and opportunity close rates between trained and untrained sales cohorts using Salesforce Sales Cloud reports.
Lead Conversion Rate
What it measures: The percentage of leads that progress to qualified opportunities and ultimately to closed deals following Salesforce training.
Why it matters: Training sales and marketing teams to properly manage lead stages, scoring, and nurturing in Salesforce should produce measurable improvements in conversion rates. This is a direct business outcome metric that resonates powerfully with revenue-focused executives.
How to track it: Use Salesforce lead conversion reports and campaign performance dashboards. Compare conversion rates across periods before and after training implementation.
Case Resolution Time
What it measures: The average time it takes for trained customer service agents to resolve customer cases from creation to closure in Salesforce Service Cloud.
Why it matters: Faster case resolution improves customer satisfaction, reduces service costs, and increases agent capacity. If Salesforce Service Cloud training is effective, resolution times should decrease meaningfully.
How to track it: Salesforce Service Cloud provides out-of-the-box case resolution time reports. Track average handle time, first contact resolution rate, and escalation rates before and after training.
Campaign ROI
What it measures: The financial return generated by marketing campaigns managed in Salesforce Marketing Cloud or Pardot relative to campaign costs.
Why it matters: Marketing teams trained to use Salesforce’s campaign management, segmentation, and analytics tools should produce higher-performing campaigns with better targeting and clearer attribution.
How to track it: Use Salesforce campaign ROI reports and connected marketing analytics dashboards to compare campaign performance metrics across trained versus undertrained marketing teams.
Forecast Accuracy
What it measures: The degree to which sales managers’ Salesforce-generated revenue forecasts match actual closed revenue over a given period.
Why it matters: Accurate forecasting is a hallmark of mature Salesforce adoption. Sales managers trained to properly use Salesforce forecasting tools — including opportunity stages, probability weighting, and collaborative forecasting — should produce forecasts that are significantly closer to actual results.
How to track it: Compare forecasted versus actual revenue in Salesforce forecast reports, measured monthly and quarterly before and after training.
Level 4: ROI Metrics — What Is the Financial Return on Salesforce Training?
The final and most strategically powerful layer of measurement quantifies the financial impact of your Salesforce training investment. These Salesforce training ROI metrics translate everything learned in the previous three levels into business value that resonates with the C-suite.
Reduced Consulting and External Support Costs
When employees are properly trained on Salesforce, organizations rely less on expensive external Salesforce consultants and system integrators for routine administration tasks. Track the reduction in consulting invoices correlated with training programs to quantify this impact.
Example calculation: If your organization spent $150,000 annually on Salesforce admin consulting before training and reduced that to $90,000 following an internal admin training program, the training delivered $60,000 in direct cost savings.
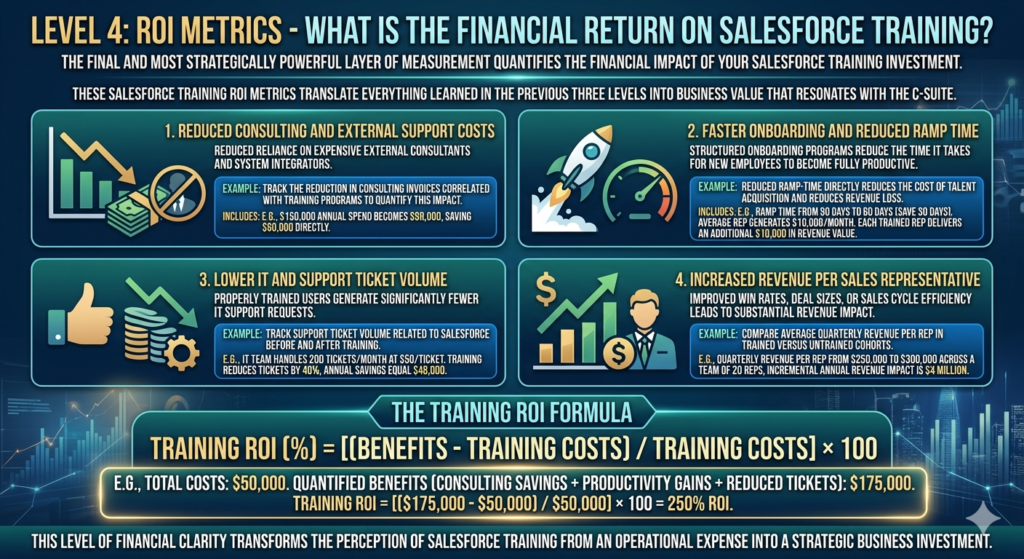
Faster Onboarding and Reduced Ramp Time
Structured Salesforce onboarding training programs reduce the time it takes for new employees to become fully productive. This directly reduces the cost of talent acquisition and reduces revenue loss from slow ramp periods.
Example calculation: If a sales rep historically took 90 days to reach full productivity and training reduces that to 60 days, and the average rep generates $10,000 per month in revenue, each trained rep delivers an additional $10,000 in revenue value per onboarding cycle.
Lower IT and Support Ticket Volume
Properly trained Salesforce users generate significantly fewer IT support requests. Track support ticket volume related to Salesforce before and after training to quantify helpdesk cost savings.
Example calculation: If your IT team handles 200 Salesforce-related support tickets per month at an average cost of $50 per ticket resolution, and training reduces tickets by 40%, the annual savings equals $48,000.
Increased Revenue Per Sales Representative
If Salesforce sales training improves win rates, deal sizes, or sales cycle efficiency, the revenue impact can be substantial. Compare average quarterly revenue per rep in trained versus untrained cohorts.
Example calculation: If training improves average revenue per rep from $250,000 to $300,000 per quarter across a team of 20 reps, the incremental annual revenue impact is $4 million.
The Training ROI Formula
The standard formula for calculating training ROI is:
textTraining ROI (%) = [(Benefits - Training Costs) / Training Costs] × 100
Example:
- Total training program costs: $50,000
- Quantified benefits (consulting savings + productivity gains + reduced tickets): $175,000
- Training ROI = [($175,000 – $50,000) / $50,000] × 100 = 250% ROI
This level of financial clarity is what transforms the perception of Salesforce training from an operational expense into a strategic business investment.
Top 10 Salesforce Training Effectiveness Metrics to Track
Here is a consolidated reference list of the most important salesforce training effectiveness metrics every organization should monitor:
| # | Metric | Category | What It Proves |
|---|---|---|---|
| 1 | Course Completion Rate | Learning | Training engagement and accessibility |
| 2 | Certification Pass Rate | Learning | Externally validated competency |
| 3 | Time to Proficiency | Learning/Adoption | Speed of operational readiness |
| 4 | User Adoption Rate | Adoption | Percentage of active Salesforce users post-training |
| 5 | Data Quality Score | Adoption | Accuracy and completeness of Salesforce data |
| 6 | Productivity Improvement | Performance | Output per employee increase post-training |
| 7 | Lead Conversion Rate | Performance | Commercial impact of sales training |
| 8 | Support Ticket Reduction | ROI | Cost savings from reduced helpdesk burden |
| 9 | Revenue Impact | ROI | Direct financial return from trained employees |
| 10 | Training ROI Percentage | ROI | Overall financial return on L&D investment |
Bonus metrics to consider: Employee Confidence Score (self-reported proficiency before and after training) and Manager Satisfaction Score (manager assessment of employee Salesforce competency post-training).
Sample KPI Dashboard for Salesforce Training
An effective executive dashboard for Salesforce training should consolidate data from multiple sources into a single, visually clear view. Here is what your training KPI dashboard should include:
Dashboard Section 1: Training Participation
- Total employees trained (month, quarter, year-to-date)
- Completion rate by department and role
- Certification counts and progress toward certification goals
- Trailhead badge and trail completion totals
Dashboard Section 2: Skill Assessment Scores
- Average pre-training versus post-training assessment scores
- Knowledge gain percentage by training program
- Learner satisfaction NPS score
- Skill gap heatmap by role or department
Dashboard Section 3: Adoption Trends
- Weekly active Salesforce users (post-training trend)
- Login frequency by role and training cohort
- Dashboard view frequency
- Record creation volume and data quality score trends
Dashboard Section 4: Performance Metrics
- Sales productivity index (revenue per rep)
- Lead conversion rate trend
- Average case resolution time trend
- Forecast accuracy percentage
Dashboard Section 5: ROI Summary
- Total training investment (current period)
- Quantified benefits (broken down by category)
- Training ROI percentage
- Cost per trained employee versus industry benchmark
This dashboard should be refreshed monthly and reviewed in quarterly L&D steering committee meetings to drive continuous program improvement.
How to Measure Salesforce Training: A Step-by-Step Framework
Here is a practical, repeatable process for measuring Salesforce training effectiveness metrics within your organization:
Step 1: Define Clear Training Objectives
Before launching any Salesforce training program, articulate what success looks like in specific, measurable terms. Do not say “employees will understand Salesforce.” Instead say “sales reps will increase their opportunity pipeline update frequency from twice per week to daily within 30 days of training completion.”
Step 2: Select Relevant Salesforce Training KPIs
Choose three to five KPIs per training program that align directly with your stated objectives. Not every program needs to track every metric. Match your KPIs to the level of training — introductory programs focus on learning metrics; advanced programs should move toward performance and ROI metrics.
Step 3: Capture Baseline Metrics Before Training Begins
This step is absolutely critical and frequently skipped. Without baseline data, you cannot prove improvement. Before training launches, document current completion rates, average assessment scores, Salesforce login frequency, data quality scores, and relevant performance indicators for your target employee group.
Step 4: Track Post-Training Changes at Defined Intervals
Measure your selected KPIs at 30, 60, and 90 days post-training. Some metrics — like assessment scores — will be available immediately. Others — like lead conversion rate improvements — may take 60-90 days to manifest in your data.
Step 5: Review Results with Stakeholders
Present your training effectiveness data to key stakeholders including business unit leaders, Salesforce admins, HR leadership, and finance. Frame results in terms of business impact, not just learning metrics. Show the full picture from completion rates through to revenue impact.
Step 6: Optimize Future Programs Based on Data
Use your measurement results to make evidence-based improvements to your Salesforce training curriculum. If assessment scores are high but adoption is low, add scenario-based practice modules. If adoption is strong but performance metrics are not moving, investigate process, tool, or change management barriers outside of training itself.
Common Mistakes to Avoid When Measuring Salesforce Training
Even well-intentioned L&D teams fall into predictable measurement traps. Here are the most common mistakes to watch for:
Mistake 1: Measuring Only Completion Rates
Completion rates are the starting point, not the destination. An organization that reports 95% course completion but cannot show any adoption or performance improvement has not measured training effectiveness — it has measured attendance.
Mistake 2: Ignoring Business Outcomes
Training metrics that stop at Level 1 (learning) miss the most important question: Did training change how people work and what business results did that change produce? Always design measurement systems that extend from learning through to performance and ROI.
Mistake 3: Failing to Set Baselines
Without before-and-after comparisons, you cannot prove causality or improvement. Baseline measurement is non-negotiable. Build it into the planning phase of every training program.
Mistake 4: Tracking Too Many Irrelevant Metrics
More metrics do not equal better measurement. A focused set of five to eight well-chosen KPIs aligned with specific training objectives will drive better decisions than a sprawling list of forty metrics with no strategic coherence.
Mistake 5: Failing to Gather Ongoing Learner Feedback
Post-course surveys are important, but they should not be the only feedback mechanism. Implement 30-day and 90-day follow-up surveys to understand how learners are applying their Salesforce training on the job and what additional support they need.
Mistake 6: Attributing All Performance Changes to Training Alone
Be intellectually honest about correlation versus causation. Sales performance improvements may reflect market conditions, product changes, or management coaching in addition to training. Use controlled comparisons between trained and untrained cohorts where possible to isolate training’s contribution.
Best Tools for Tracking Salesforce Training Metrics
You do not need a complex technology stack to track salesforce training effectiveness metrics effectively. Here are the best tools available:
Salesforce Reports and Dashboards (Native)
Salesforce itself is your most powerful adoption measurement tool. Native reports track login history, record activity, dashboard usage, pipeline metrics, and case performance — all the data you need for Level 2 and Level 3 measurement. Build a dedicated training effectiveness dashboard directly in Salesforce and share it with your L&D and admin teams.
Trailhead by Salesforce
Salesforce’s free learning platform provides built-in tracking of badge completions, trail progress, points earned, and certification preparation activity. My Trailhead reporting and Trailhead for Business tools allow administrators to assign learning paths and track team progress in real time.
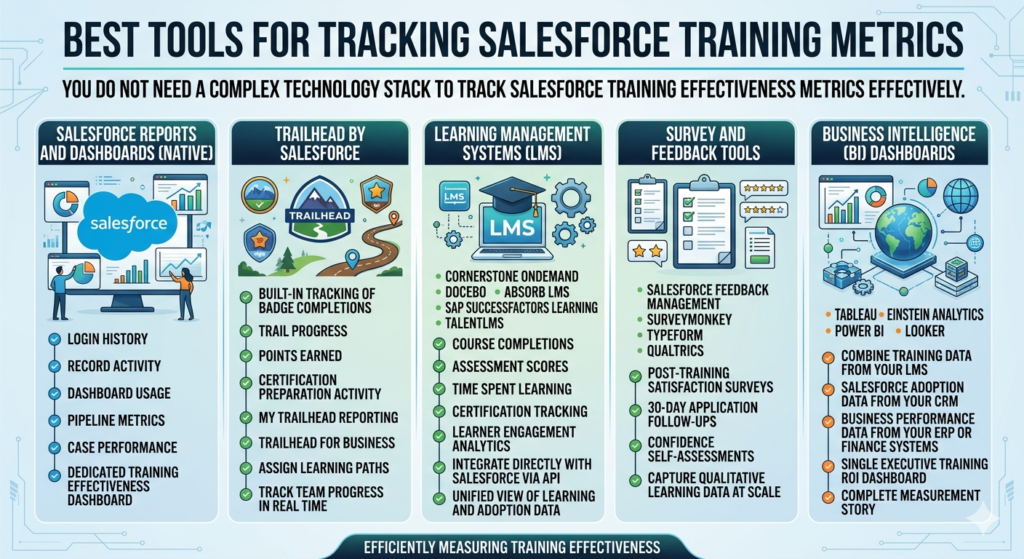
Learning Management Systems (LMS)
Platforms like Cornerstone OnDemand, Docebo, Absorb LMS, SAP SuccessFactors Learning, and TalentLMS provide robust tracking of course completions, assessment scores, time spent learning, certification tracking, and learner engagement analytics. Many integrate directly with Salesforce via API to create a unified view of learning and adoption data.
Survey and Feedback Tools
Salesforce Feedback Management, SurveyMonkey, Typeform, and Qualtrics enable you to deploy post-training satisfaction surveys, 30-day application follow-ups, and confidence self-assessments to capture qualitative learning data at scale.
Business Intelligence (BI) Dashboards
Tableau (now part of Salesforce), Einstein Analytics, Power BI, and Looker enable you to combine training data from your LMS, Salesforce adoption data from your CRM, and business performance data from your ERP or finance systems into a single executive training ROI dashboard that tells the complete measurement story.
Conclusion: From Training Delivery to Proven Business Impact
The era of measuring Salesforce training success by counting completions and tallying certifications is over. In today’s data-driven business environment, L&D leaders, Salesforce admins, and business executives must hold training programs to a much higher standard of accountability.
By implementing a structured, four-level measurement framework — learning metrics, adoption metrics, performance metrics, and ROI metrics — organizations can move from anecdotal evidence to data-driven proof of training impact. The right Salesforce training effectiveness metrics reveal not just whether employees learned, but whether they changed how they work, whether the business performed better as a result, and whether the training investment generated a measurable financial return.
The organizations that will win with Salesforce in the years ahead are not simply those that invest the most in training. They are the organizations that invest in the right training, measure its impact rigorously, and use data to continuously improve their learning and development strategy.
Measurement is not the end of the training journey. It is what makes the journey purposeful.
About RizeX Labs
At RizeX Labs, we specialize in delivering role-based Salesforce training programs that help organizations build in-house expertise and maximize platform adoption. Our corporate Salesforce training services are designed to equip teams with practical skills across administration, development, automation, DevOps, AI, and analytics.
Our training approach combines hands-on learning, real-world use cases, and measurable outcomes to ensure that organizations can confidently evaluate the business impact of their enablement initiatives using proven salesforce training effectiveness metrics and salesforce training KPIs.
We help organizations move beyond course completion and certification tracking to truly measure Salesforce training success through adoption, productivity, and ROI-focused metrics.
Internal Linking Opportunities:
External Linking Opportunities:
- Salesforce official website: Salesforce
- Trailhead learning platform: Trailhead by Salesforce
- Salesforce Adoption Dashboards: Salesforce Help
- Salesforce Reports and Dashboards: Salesforce Reporting Overview
- Kirkpatrick Training Evaluation Model: Kirkpatrick Model
- ROI Institute methodology: ROI Institute
- Learning management systems (LMS) for training analytics
Quick Summary
Measuring Salesforce training effectiveness is essential for proving the value of learning investments and ensuring that employees apply their new skills on the job. By tracking structured salesforce training effectiveness metrics, organizations can assess learning outcomes, monitor user adoption, and connect training efforts directly to business performance.
Key salesforce training KPIs include course completion rates, certification pass rates, time to proficiency, Salesforce usage trends, productivity improvements, and ROI. When organizations consistently measure Salesforce training, they gain the insights needed to optimize future programs, increase platform adoption, and maximize the return on their Salesforce investment.