Introduction: Why Data Intelligence Is No Longer Optional in 2026
Imagine walking into a meeting with every answer your client could possibly ask — revenue trends, customer churn risks, top-performing products, and future forecasts — all at your fingertips before anyone even opens a spreadsheet.
That is exactly what Salesforce Einstein Analytics makes possible.
In 2026, businesses are no longer competing just on products or prices. They are competing on how fast and how accurately they can act on data. Companies that harness the power of analytics are outpacing those that rely on guesswork. And for Salesforce users, Einstein Analytics is the built-in superpower that makes this possible.
Whether you are a Salesforce beginner, a seasoned CRM administrator, or a business leader exploring smarter tools, this guide by RizeX Labs is designed specifically for you.
This comprehensive blog will walk you through everything you need to know about Salesforce Einstein Analytics for beginners in 2026 — from what it actually is, to how to build your first dashboard, and everything in between. We will keep things simple, practical, and immediately useful.
Let us get started.
Table of Contents
- What Is Salesforce Einstein Analytics?
- Einstein Analytics vs. Tableau CRM: Understanding the Naming Evolution
- Key Components: Dashboards, Datasets, Lenses, and AI Insights
- Why Salesforce Einstein Analytics Matters for Beginners
- Benefits of Einstein Analytics for Businesses in 2026
- Step-by-Step Guide: Getting Started with Salesforce Einstein Analytics
- Real-World CRM Analytics Use Cases
- Best Practices for Beginners in 2026
- Common Mistakes to Avoid
- Frequently Asked Questions (FAQs)
- Conclusion: The Future Scope of Salesforce Einstein Analytics
1. What Is Salesforce Einstein Analytics?
Salesforce Einstein Analytics is a cloud-based business intelligence and analytics platform built natively inside Salesforce. It allows users to explore data, discover patterns, predict outcomes, and take action — all without leaving the Salesforce ecosystem.
At its core, Einstein Analytics is designed to make data-driven decision-making accessible to everyone, not just data scientists or IT professionals.
Here is a simple way to think about it:
Traditional analytics tells you what happened. Einstein Analytics tells you what happened, why it happened, and what is likely to happen next.
What Makes It “Einstein”?
The Einstein in the name refers to Salesforce’s artificial intelligence layer, which powers predictive analytics, intelligent recommendations, and automated insights. This AI layer is embedded throughout the Salesforce platform, making your CRM smarter with every interaction.
Einstein Analytics brings together:
- Data visualization tools to build stunning dashboards
- AI-powered predictions to forecast trends and risks
- Natural language processing (NLP) so you can ask questions in plain English
- Pre-built templates for sales, service, marketing, and more
- Real-time data connections from Salesforce CRM and external sources
In simple terms, Einstein Analytics is your intelligent data companion inside Salesforce.
2. Einstein Analytics vs. Tableau CRM: Understanding the Naming Evolution
If you have been researching this topic, you may have come across the term Tableau CRM. Let us clear up any confusion right away.
A Brief History
- Einstein Analytics was the original name Salesforce used for its analytics platform.
- In 2021, Salesforce rebranded Einstein Analytics to Tableau CRM after acquiring Tableau, a leading data visualization company.
- By 2023–2024, Salesforce began merging and unifying these platforms, and in 2026, the branding has settled under the broader Salesforce Analytics Cloud umbrella, with many users and official documentation still referring to it as Einstein Analytics or Tableau CRM interchangeably.
So, Which Name Should You Use?
For practical purposes in 2026:
| Term | What It Means |
|---|---|
| Einstein Analytics | The AI-powered analytics layer built into Salesforce |
| Tableau CRM | The rebranded name for the same product, now part of Analytics Cloud |
| Salesforce Analytics Cloud | The broader platform encompassing Einstein Analytics, Tableau integration, and more |
As a beginner, do not get confused by the naming. Whether your organization calls it Einstein Analytics, Tableau CRM, or Analytics Cloud, the core functionality and learning path remain very similar.
RizeX Labs Tip: In most Salesforce certifications and beginner courses in 2026, “Einstein Analytics” and “Tableau CRM” are treated as the same foundational product. Learning one means learning the other.
3. Key Components: Dashboards, Datasets, Lenses, and AI Insights
Before you start building anything, you need to understand the four building blocks of Salesforce Einstein Analytics. Think of these as the LEGO pieces that come together to create powerful analytics experiences.
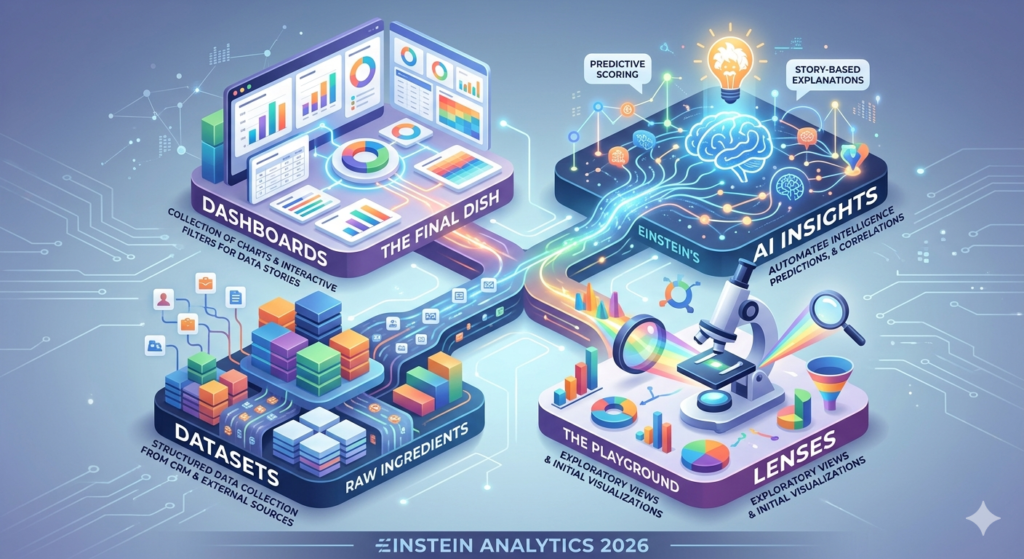
3.1 Datasets: The Foundation of Everything
A dataset is a structured collection of data that you load into Einstein Analytics for analysis.
Think of it this way: If Einstein Analytics is a kitchen, the dataset is your raw ingredient — the data you will cook with.
Key things to know about datasets:
- Datasets can be pulled directly from Salesforce CRM objects (like Accounts, Opportunities, Cases)
- You can also bring in external data from CSV files, databases, or third-party systems
- Datasets are stored in Einstein Analytics and optimized for fast querying
- You can schedule automatic data refreshes so your analysis is always current
- A dataset can contain millions of rows and still be processed quickly thanks to Einstein’s in-memory architecture
Examples of common datasets:
- Sales pipeline data (Opportunities)
- Customer support tickets (Cases)
- Marketing campaign performance
- Product revenue by region
- Employee performance metrics
3.2 Lenses: Exploring Your Data
A lens is an exploratory view of a dataset. It is where you go to ask questions about your data and see initial visualizations.
Think of it this way: If the dataset is your raw ingredient, the lens is where you taste and experiment before finalizing the recipe.
What you can do in a lens:
- Group data by fields (e.g., group opportunities by stage)
- Apply filters (e.g., show only Q1 2026 data)
- Choose visualization types (bar chart, pie chart, funnel, scatter plot)
- Sort, compare, and drill down into specific segments
- Save promising views to use in dashboards
Lenses are temporary and exploratory by nature. They are your playground for data discovery. Once you find something valuable, you can pin it into a dashboard.
3.3 Dashboards: Your Visual Command Center
A dashboard is a collection of charts, tables, and widgets assembled together to tell a complete data story.
Think of it this way: A dashboard is the final dish — beautifully presented and ready to serve to your audience.
Key dashboard features in Einstein Analytics 2026:
- Drag-and-drop interface for arranging components
- Interactive filters that let viewers slice the data themselves
- Connected steps — when you click one chart, other charts update automatically
- Embedded AI insights that highlight anomalies or trends automatically
- Mobile-responsive design for viewing on phones and tablets
- Role-based sharing so different teams see the data relevant to them
Popular dashboard types:
- Sales performance dashboards
- Customer service efficiency dashboards
- Executive summary dashboards
- Pipeline forecast dashboards
- Marketing ROI dashboards
3.4 AI Insights: The Smart Layer
This is where Einstein Analytics truly shines over traditional BI tools.
AI Insights refers to the artificial intelligence layer that automatically analyzes your data and surfaces important findings — without you having to know what to look for.
What AI Insights can do:
- Einstein Discovery: Automatically discovers patterns and correlations in your data. For example, it might tell you that deals closed by representatives with more than 5 follow-up calls have a 40% higher win rate.
- Predictive Scoring: Scores each record (like a lead or opportunity) based on its likelihood to convert or close.
- Natural Language Querying: You can literally type “What were my top 5 products by revenue in Q1 2026?” and Einstein will generate the visualization.
- Automated Anomaly Detection: Flags unusual spikes or drops in your metrics before you notice them.
- Story-Based Explanations: Instead of just showing a chart, Einstein tells you the story behind the data in plain English.
RizeX Labs Insight: AI Insights is the feature that separates Einstein Analytics from older reporting tools. As a beginner, focus on learning dashboards and datasets first, then layer in AI insights as you grow.
4. Why Salesforce Einstein Analytics Matters for Beginners
You might be wondering: “This sounds powerful, but is it really for someone just starting out?”
The answer is a resounding yes, and here is why.
For Salesforce Beginners:
- The App Exchange templates mean you can have a working dashboard in minutes, even without coding knowledge
- The guided setup wizards walk you through connecting data step by step
- Pre-built apps for Sales Analytics, Service Analytics, and more come ready to use out of the box
- A drag-and-drop interface means you do not need to write complex SQL queries
- Trailhead learning paths from Salesforce make it easy to learn at your own pace
For CRM Professionals and Admins:
- Deep integration with Salesforce CRM means no data silos or export/import headaches
- You can answer business questions in real time without waiting for IT reports
- Einstein Discovery can do the statistical analysis for you — no data science degree required
- Sharing insights with stakeholders is one click away
5. Benefits of Einstein Analytics for Businesses in 2026
Let us zoom out and look at the bigger picture. Why should your organization invest time and resources in Salesforce Einstein Analytics?
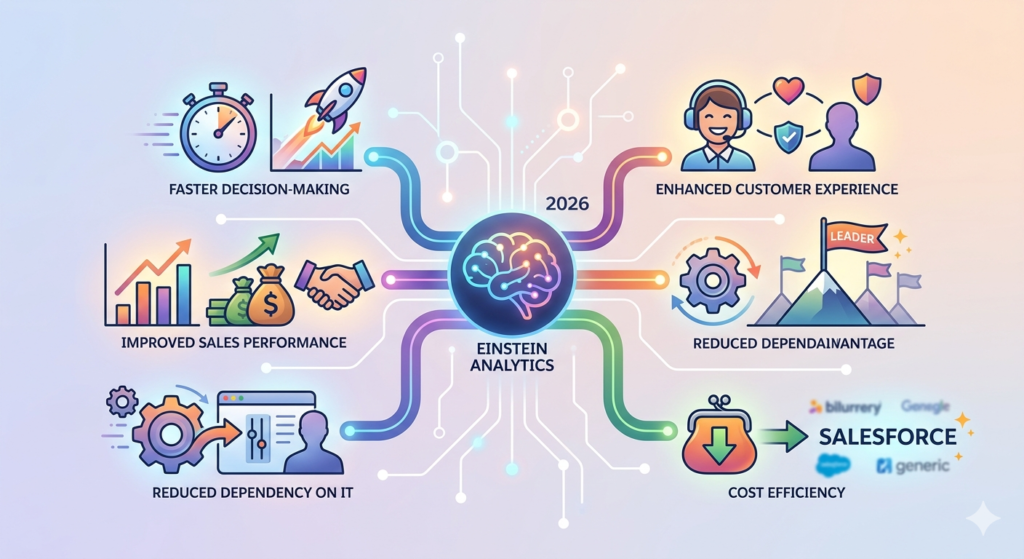
5.1 Faster Decision-Making
Traditional reporting cycles can take days or weeks. With Einstein Analytics, your leadership team has real-time visibility into every critical metric — from pipeline health to customer satisfaction scores — instantly available on any device.
5.2 Improved Sales Performance
Sales teams using Einstein Analytics consistently report:
- Shorter sales cycles
- Higher lead conversion rates
- Better forecast accuracy
- More focused pipeline management
Why? Because they know exactly which opportunities to prioritize and which deals are at risk of slipping.
5.3 Enhanced Customer Experience
When your service team can see a customer’s complete history — previous issues, buying patterns, escalation risks — they can provide proactive, personalized support instead of reactive firefighting.
5.4 Reduced Dependency on IT
Business users and admins can build and modify dashboards themselves without waiting for IT to generate reports. This dramatically speeds up the insight-to-action cycle.
5.5 Competitive Advantage
In 2026, the companies that can act on data faster and more accurately than competitors are the ones winning market share. Einstein Analytics provides that edge.
5.6 Cost Efficiency
By having all analytics native within Salesforce, businesses eliminate the need for multiple third-party BI tools, reducing software licensing costs and integration complexity.
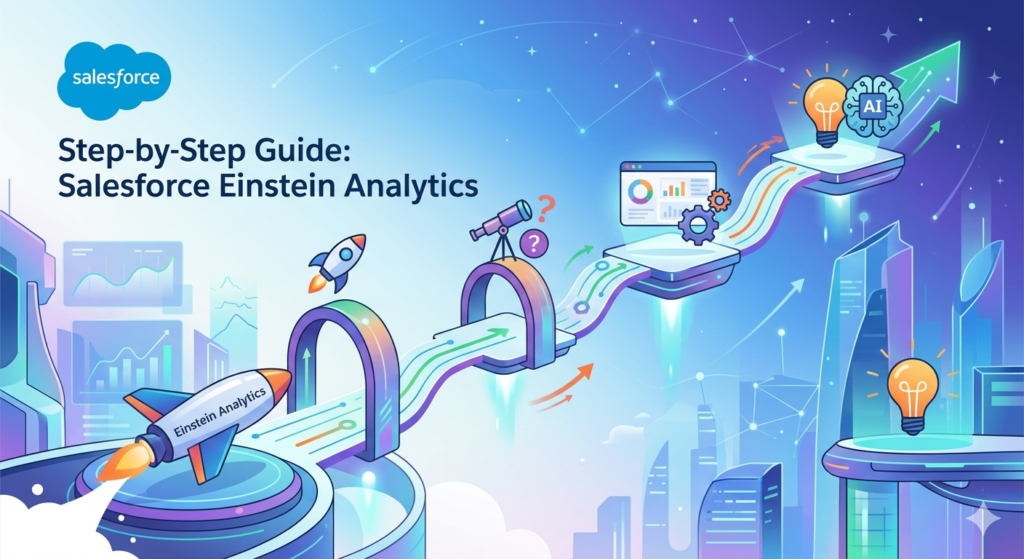
6. Step-by-Step Guide: Getting Started with Salesforce Einstein Analytics
Now let us get into the practical side. Here is your beginner-friendly step-by-step guide to getting started with Salesforce Einstein Analytics in 2026.
Step 1: Verify Your Salesforce Edition and License
Einstein Analytics is available in:
- Salesforce Enterprise Edition (with additional license)
- Salesforce Unlimited Edition
- Specific industry clouds (Financial Services Cloud, Health Cloud, etc.)
Action: Go to Setup → Company Information → check your Salesforce Edition. Then contact your Salesforce admin or account executive to confirm Einstein Analytics is enabled for your org.
Step 2: Enable Einstein Analytics in Your Org
If you have the appropriate license, an admin needs to enable Einstein Analytics:
- Go to Setup
- In the Quick Find box, type Analytics
- Click Analytics Settings (or Getting Started)
- Toggle Enable Analytics to ON
- Click Save
Once enabled, you will see the Analytics Studio app appear in your App Launcher.
Step 3: Access Analytics Studio
- Click the App Launcher (the grid icon in the top-left corner)
- Search for Analytics Studio
- Click to open it
This is your home base for everything Einstein Analytics. From here, you can create dashboards, explore datasets, and access pre-built apps.
Step 4: Explore Pre-Built Analytics Apps
Before building from scratch, explore what is already available.
- In Analytics Studio, click Create
- Select App
- Choose From Template
- Browse templates like:
- Sales Analytics
- Service Analytics
- Pipeline Inspection Analytics
- B2B Marketing Analytics
- Select a template, click Continue, and follow the configuration wizard
These templates automatically connect to your existing Salesforce CRM data and create ready-to-use dashboards. This is the fastest way to see Einstein Analytics in action.
Step 5: Create Your First Dataset
Once you are comfortable with templates, try creating your own dataset:
- In Analytics Studio, click Create
- Select Dataset
- Choose your data source:
- Salesforce (connects directly to your CRM objects)
- CSV Upload (for external data)
- Connected Objects (relate multiple Salesforce objects)
- Select the fields you want to include
- Name your dataset and click Create Dataset
Wait for the data sync to complete (usually a few minutes for smaller datasets).
Step 6: Explore Data with Lenses
- Click on your newly created dataset
- Click Explore to open it as a lens
- Try grouping the data by a field (e.g., “Stage” for Opportunities)
- Add a measure (e.g., “Sum of Amount”)
- Change the visualization type (bar chart, donut, table)
- Add filters to narrow the data
Practice tip: Try answering a simple business question like “Which sales stage has the highest total opportunity value?”
Step 7: Build Your First Dashboard
- In Analytics Studio, click Create → Dashboard
- You will enter the Dashboard Designer
- Click Add Widget (or the + icon)
- Choose widget types: Chart, Table, KPI, Filter, Text
- Connect each widget to a dataset
- Arrange widgets using drag-and-drop
- Add filters so viewers can slice the data dynamically
- Click Save and name your dashboard
- Click Share to give access to colleagues
Congratulations — you have just built your first Einstein Analytics dashboard!
Step 8: Explore Einstein Discovery
Once you are comfortable with dashboards, dive into AI:
- Go to Einstein Discovery (found within Analytics Studio or Setup)
- Select a dataset (e.g., Opportunity data)
- Choose the outcome you want to predict (e.g., “Will this opportunity close?”)
- Let Einstein analyze the data
- Review the Story — Einstein will explain what factors influence the outcome and by how much
This is where the real magic happens for business decision-making.
Step 9: Learn Continuously on Trailhead
Salesforce’s free learning platform, Trailhead, has dedicated modules:
- Einstein Analytics Basics
- Analytics Studio Basics
- Tableau CRM and Einstein Discovery
- Build Your First Dashboard
RizeX Labs recommends: Complete the “Analytics Cloud Explorer” Superbadge on Trailhead for a structured, hands-on learning experience.
7. Real-World CRM Analytics Use Cases
Understanding theory is one thing. Seeing how real businesses use Einstein Analytics makes it truly click.
Use Case 1: Sales Pipeline Management
Scenario: A sales manager at a mid-sized B2B company needs to know which deals are most likely to close this quarter.
How Einstein Analytics helps:
- Pulls all open opportunities from Salesforce CRM
- Shows pipeline by stage, rep, and expected close date
- Einstein Discovery scores each deal for win probability
- Flags at-risk deals with recommended next actions
- The manager can reallocate resources to the most promising deals
Result: 23% improvement in quarterly forecast accuracy.
Use Case 2: Customer Service Optimization
Scenario: A customer service director wants to reduce average case resolution time.
How Einstein Analytics helps:
- Dashboard shows average handle time by agent, product, and issue type
- Identifies that a specific product category has 3x longer resolution time
- Drills down to reveal those cases are being routed to the wrong team
- Service director updates routing rules
Result: Average resolution time drops by 35% in one month.
Use Case 3: Marketing Campaign Performance
Scenario: A marketing team wants to understand which campaigns are generating the best ROI.
How Einstein Analytics helps:
- Connects campaign data, lead data, and opportunity data
- Visualizes the full funnel from campaign impression to closed deal
- AI insights reveal that email campaigns targeting existing customers convert 4x better than cold outreach
- Budget reallocated accordingly
Result: Marketing ROI improves by 41% in the next campaign cycle.
Use Case 4: Retail Revenue Forecasting
Scenario: A retail chain needs to forecast next quarter’s revenue by region.
How Einstein Analytics helps:
- Historical sales data combined with seasonal trends
- Einstein’s predictive models generate revenue forecasts by store, region, and product category
- Regional managers receive personalized dashboards on their mobile devices
Result: Inventory planning improved, reducing overstock costs by 18%.
8. Best Practices for Beginners in 2026
As you embark on your Einstein Analytics journey, keep these best practices in mind to accelerate your learning and avoid common pitfalls.
8.1 Start with a Business Question, Not a Dataset
The most common beginner mistake is diving into data without a clear purpose.
Always start with: “What business question am I trying to answer?”
Examples:
- “Why is our win rate dropping in the Northeast region?”
- “Which customer segments have the highest churn risk?”
- “What is our average deal size by industry?”
Once you have a clear question, building the right dataset and dashboard becomes much easier.
8.2 Keep Dashboards Simple and Focused
Resist the urge to cram 20 charts onto one dashboard. Less is more.
A great dashboard should:
- Answer 3–5 specific questions
- Be understandable in under 30 seconds
- Use consistent color coding
- Have a logical flow from overview to detail
8.3 Use Pre-Built Apps as Learning Templates
Do not reinvent the wheel. Explore the pre-built Sales Analytics and Service Analytics apps, then:
- Examine how the datasets are structured
- Study how the dashboard components are connected
- Customize them to fit your specific needs
This reverse-engineering approach is one of the fastest ways to learn.
8.4 Maintain Data Quality
Analytics is only as good as the data behind it. Work with your Salesforce admin to:
- Enforce required fields on key Salesforce objects
- Establish data validation rules
- Standardize picklist values
- Schedule regular data audits
Garbage in, garbage out. Clean data is the foundation of trustworthy analytics.
8.5 Learn SAQL (Salesforce Analytics Query Language) Gradually
SAQL is the query language used behind the scenes in Einstein Analytics. As a beginner, you do not need to know it right away — the visual interface handles most things.
But as you advance, learning basic SAQL will help you:
- Create more complex filters
- Build custom calculations
- Handle edge cases the UI cannot address
Start with the UI. Learn SAQL as you grow.
8.6 Leverage Mobile Access
Einstein Analytics dashboards are fully mobile-responsive. Encourage your team leaders and sales reps to access dashboards on their phones. Mobile analytics adoption dramatically increases how often data is actually used to make decisions.
8.7 Iterate and Improve Based on User Feedback
Build a dashboard, share it with your team, and ask:
- “What questions does this NOT answer that you need answered?”
- “Is anything confusing or hard to find?”
- “What would make this more useful for your daily work?”
Then iterate. Great dashboards are never finished — they evolve.
9. Common Mistakes to Avoid
Learning what NOT to do can save you months of frustration.
| Mistake | Why It Hurts | What to Do Instead |
|---|---|---|
| Building dashboards without a clear audience | Users ignore dashboards not relevant to them | Define who will use it and what decisions they need to make |
| Overcomplicating the first dashboard | Discourages adoption and causes confusion | Start with 3 simple, high-impact metrics |
| Ignoring mobile optimization | Reduces actual usage by field teams | Test every dashboard on mobile before sharing |
| Forgetting data refresh schedules | Stale data leads to wrong decisions | Set up automated daily or hourly refreshes |
| Skipping user training | Teams do not know how to use the interactive features | Host a 30-minute training session when sharing new dashboards |
| Not using roles and sharing settings | Sensitive data exposed to wrong teams | Set up appropriate row-level security from day one |
10. Conclusion: The Future Scope of Salesforce Einstein Analytics
We have covered a lot of ground in this guide — from understanding what Einstein Analytics is, to building your first dashboard, to exploring real-world use cases. Let us close with a look at where all of this is headed.
The Future of Einstein Analytics in 2026 and Beyond
The analytics landscape is evolving at an extraordinary pace, and Salesforce Einstein Analytics is evolving with it. Here are the key trends shaping its future:
🔮 Generative AI Integration
In 2026, Salesforce has deeply embedded its Einstein GPT capabilities into the analytics platform. Users can now describe the dashboard they want in plain English and have it generated automatically. This is making analytics even more accessible to complete beginners.
🔮 Unified Data Platform
Salesforce is continuing to merge Einstein Analytics, Tableau, Data Cloud (formerly CDP), and MuleSoft integrations into a unified data intelligence platform. This means richer, more connected analytics with less technical overhead.
🔮 Predictive and Prescriptive Analytics at Scale
The shift from descriptive analytics (“what happened?”) to prescriptive analytics (“what should we do?”) is accelerating. Einstein Discovery’s recommendations will become even more sophisticated, essentially serving as an AI-powered business advisor embedded in your CRM.
🔮 Industry-Specific AI Models
Salesforce is releasing pre-trained AI models tailored to specific industries — healthcare, financial services, manufacturing, retail — making it faster to deploy relevant insights without custom model training.
🔮 Democratized Data Access
The goal is clear: everyone in an organization, from the CEO to a field sales rep, should have instant access to the insights they need, on any device, at any time. Einstein Analytics is the vehicle for achieving that vision.
About RizeX Labs
At RizeX Labs, we specialize in delivering advanced Salesforce analytics and AI-powered CRM solutions using Salesforce Einstein Analytics and Tableau CRM. Our team helps businesses transform raw customer and sales data into actionable insights through interactive dashboards, predictive analytics, and intelligent reporting.
With deep Salesforce expertise and practical implementation experience, we help organizations improve decision-making, automate reporting workflows, and gain real-time visibility into business performance across sales, marketing, and customer service operations.
Internal Links:
- Salesforce Admin course page
- Salesforce Marketing Cloud vs Pardot: Which Is Right for You in 2026
- Agentforce Topics and Actions: Complete Configuration Guide
- SFMC Data Extensions vs Lists: What Every Marketer Should Know
- SFMC Email Content Builder: Best Practices & Templates 2026
- SFMC Query Activity SQL: The Complete Guide to Marketing Cloud SQL for Data-Driven Marketers
- SFMC Einstein Send Time Optimization: How It Works
External Links:
McKinsey Sales Growth Reports