
Introduction: Why Salesforce Users Confuse List Views and Reports
If you have spent any time inside a Salesforce org, you have probably found yourself staring at two screens and asking the same question thousands of Salesforce admins, developers, and business analysts ask every day: Should I build a list view or a report for this?
It sounds like a simple question. But the answer is more nuanced than most beginners realize — and even experienced professionals sometimes pick the wrong tool for the job. The result? Wasted time, bloated report folders, confused end users, and missed opportunities for real data-driven decisions.
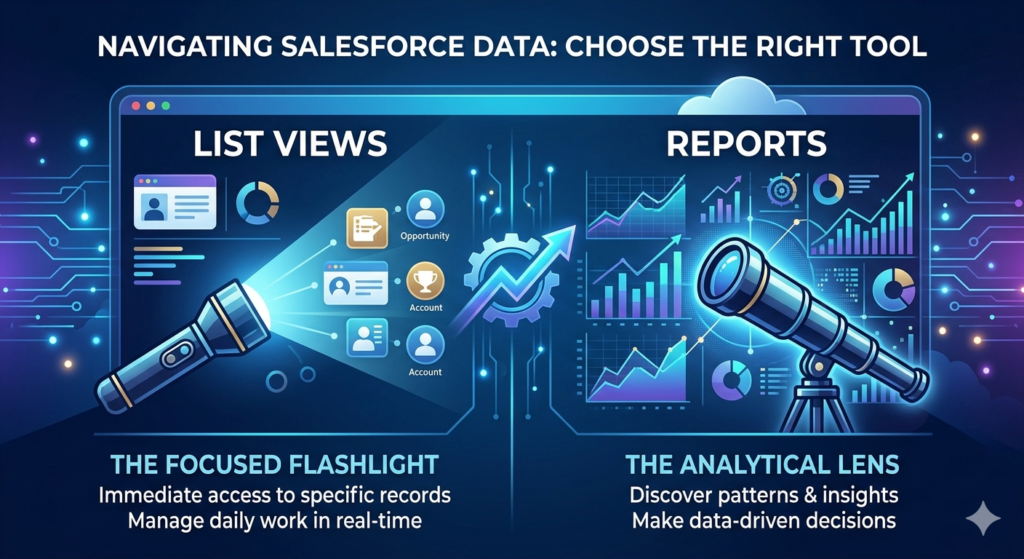
Here is the truth: Salesforce list views vs reports is not really a competition. They are two different instruments built for two different jobs. One is like a focused flashlight that helps you see exactly what is in front of you right now. The other is like a high-powered analytical lens that helps you see patterns, trends, and insights across your entire data landscape.
Choosing the right tool at the right moment is one of the most underrated productivity skills in the Salesforce ecosystem. When you master this distinction, you improve your own workflow, help your team make smarter decisions, and unlock the true power of Salesforce reporting and data visibility.
In this guide, we will walk you through everything — from simple definitions to advanced use cases, comparison tables, common mistakes, and expert best practices. Whether you are a complete beginner just getting started with list views Salesforce features or a seasoned admin building complex dashboards for your executive team, this post has something valuable for you.
Let us dive in.
What Are Salesforce List Views? {#what-are-salesforce-list-views}
The Simple Definition
Think of a Salesforce List View as a customized, filtered window into a single object's records — displayed directly inside the Salesforce interface. When you navigate to the Leads, Accounts, Opportunities, or Cases tab, what you see by default is already a list view. It is essentially a saved filter query that shows you a subset of records in a clean, tabular format.
List views Salesforce are designed for speed, simplicity, and action. They let you see the records you care about right now, without leaving the page and without waiting for a report to run.
Breaking Down the Core Features
1. Filters
Filters are the heart of any list view. You can filter records based on field values, ownership, dates, picklist values, and more. For example, you can filter opportunities to show only deals closing this month, or filter leads to show only the ones assigned to your team.
2. Inline Editing
One of the most powerful — and often underused — features of list views is inline editing. You can click directly on a field value in the list view and update it without opening the record. Imagine updating the stage of five opportunities in under a minute without clicking into each one. That is inline editing at work.
3. Pinning
Users can pin a list view as their default view for any object. This means every time a rep opens the Leads tab, they see exactly the filtered list they need — their assigned leads, their active follow-ups, or their high-priority contacts.
4. Sharing
List views can be:
- Private (visible only to you)
- Shared with specific groups or roles
- Visible to all users
This makes them flexible enough for both personal productivity and team-wide standardization.
5. Kanban View
List views can also be toggled into a Kanban board format, which is especially useful for sales reps managing pipeline stages or support teams tracking case statuses visually.
6. Column Customization
You can choose which fields appear as columns in your list view, making it a tailored snapshot of the data that matters most for a specific workflow.
Real-World Examples of Salesforce List Views
Here are some of the most commonly used list views across Salesforce orgs:
- "My Open Leads" — Shows all leads assigned to the currently logged-in user that have not yet been converted or disqualified. Perfect for a rep starting their morning.
- "Recently Modified Accounts" — Displays accounts that were updated in the last 7 days, useful for account managers doing a quick activity review.
- "High Priority Cases" — Filters the Cases object to show only cases with a priority of "High" or "Critical" that are still open. A lifesaver for support team leads.
- "Opportunities Closing This Month" — Shows all deals with a close date falling in the current month, regardless of owner. Great for weekly pipeline reviews.
- "New Leads This Week" — Filters leads created in the past 7 days so the marketing team can quickly assess campaign performance in real time.
Who Uses List Views Most?
- Sales reps managing their daily pipeline
- Support agents triaging incoming cases
- Marketing coordinators reviewing lead queues
- Admins doing quick data checks during data quality reviews
What Are Salesforce Reports? {#what-are-salesforce-reports}
The Simple Definition
Salesforce Reports are analytical tools that let you query, aggregate, group, and visualize data across one or multiple Salesforce objects. Unlike list views that show you a flat table of individual records, reports can summarize, calculate, group, and compare data in powerful ways.
Salesforce reporting is where the platform truly begins to show its analytical muscle. Reports live in the Reports tab and are built using the Salesforce Report Builder — a point-and-click interface that requires no coding knowledge. They can be saved, scheduled, exported, and added to dashboards for executive visibility.
Report Types in Salesforce
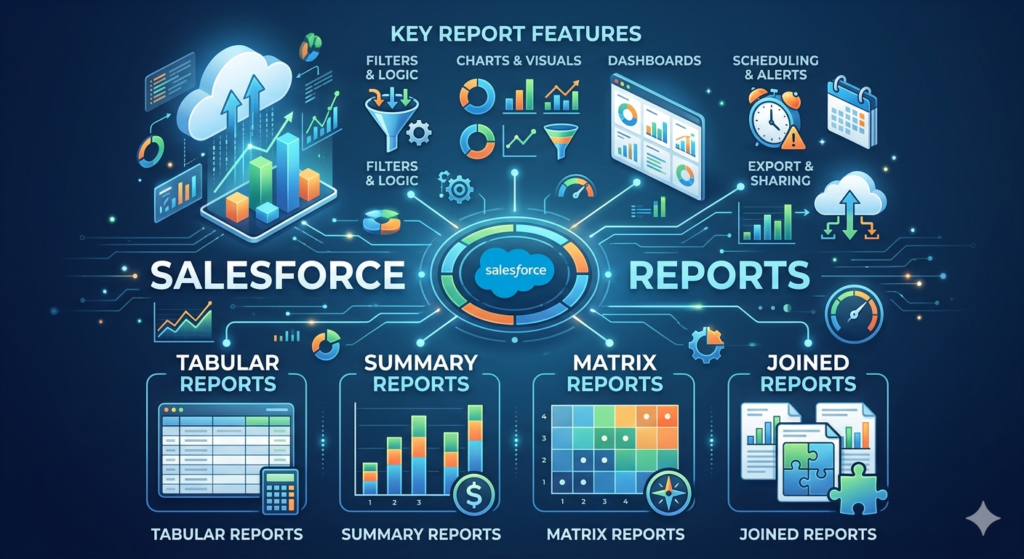
Salesforce offers four core report types, each suited for a different analytical purpose:
1. Tabular Reports
The simplest format — just rows and columns of data, like a spreadsheet. Great for generating lists with totals but cannot be grouped or used in most dashboard components.
Use case example: A list of all contacts with their email addresses for an export.
2. Summary Reports
Records are grouped by one or more fields, with subtotals and totals calculated for each group. This is the most commonly used report type for business analysis.
Use case example: Grouping opportunities by sales rep to see each rep's total pipeline value.
3. Matrix Reports
Data is grouped both by rows AND columns, creating a grid-like view. Excellent for comparing multiple dimensions simultaneously.
Use case example: Comparing monthly revenue by product line across different regions.
4. Joined Reports
The most advanced type, allowing you to combine data from multiple report blocks in a single view. Each block can have its own filters, groupings, and columns.
Use case example: Comparing this quarter's closed deals against last quarter's by product family.
Key Salesforce Reporting Features
Filters and Filter Logic
Reports support standard filters, cross-filters, and complex filter logic (AND/OR combinations), allowing extremely precise data segmentation.
Groupings and Summaries
You can group data at multiple levels and apply summary functions like Sum, Average, Count, Min, and Max to numeric fields.
Charts and Visualizations
Reports can include embedded charts — bar charts, pie charts, line graphs, donut charts, funnel charts, and more — directly inside the report.
Dashboard Integration
Reports are the backbone of Salesforce Dashboards. Any summary or matrix report can be added as a dashboard component, giving leadership teams a real-time visual overview of business performance.
Scheduling and Subscriptions
Reports can be scheduled to run automatically and delivered to users' email inboxes on a recurring basis — daily, weekly, or monthly. Users can also subscribe to report alerts.
Exporting
Reports can be exported to Excel (.xlsx), CSV, or formatted PDF formats, making them easy to share outside of Salesforce.
Cross-Object Reporting
Using Report Types that span multiple objects, you can report across relationships — for example, Accounts with their related Opportunities and Contacts in a single report.
Real-World Examples of Salesforce Reports
- Sales Pipeline Analysis — A summary report grouping open opportunities by stage with total value, showing the health of the entire pipeline.
- Rep Performance Dashboard — A matrix report comparing each sales rep's closed revenue month over month for the current quarter.
- Lead Source Effectiveness — A summary report showing how many leads came from each source and what percentage converted, helping marketing allocate budget.
- Case Resolution Time Report — Average case resolution time grouped by support team or agent to identify bottlenecks.
- Forecast Accuracy Report — Comparing committed forecast amounts to actual closed revenue.
Who Uses Salesforce Reports Most?
- Sales managers and VPs tracking team and pipeline performance
- Business analysts creating insights for strategic decisions
- Marketing teams measuring campaign ROI and lead quality
- Operations teams monitoring process efficiency and SLA compliance
- C-suite executives reviewing KPIs on dashboards
Salesforce List Views vs Reports: Key Differences {#key-differences}
Now that we understand what each tool is, let us put them side by side in a clear, structured comparison.
Comprehensive Comparison Table
| Feature | List Views (Salesforce) | Salesforce Reports |
|---|---|---|
| Primary Purpose | Quick record browsing and daily task management | Data analysis, aggregation, and business intelligence |
| Location in Salesforce | Object tabs (Leads, Accounts, etc.) | Reports Tab |
| Complexity Level | Low — beginner-friendly | Low to High — scales with need |
| Data Aggregation | No — shows individual records only | Yes — Sum, Count, Average, Min, Max |
| Grouping Capabilities | No grouping | Yes — up to 3 levels in summary/matrix |
| Data Visualization | Kanban view only | Full chart library (bar, pie, line, funnel, etc.) |
| Real-Time Interaction | Yes — live, always-current data | Yes — runs at time of execution |
| Inline Editing | Yes — edit records directly in the view | No — read-only |
| Sharing Options | Private, group, or all users | Public folders, private folders, shared folders |
| Exporting | Limited (no native Excel export) | Yes — Excel, CSV, PDF |
| Dashboard Integration | No | Yes — core component of dashboards |
| Scheduling/Automation | No | Yes — scheduled delivery and subscriptions |
| Cross-Object Reporting | No — single object only | Yes — via report types with relationships |
| Filter Logic Complexity | Basic to intermediate | Advanced — cross-filters, custom logic |
| Performance Impact | Very lightweight | Heavier for complex reports |
| Best Suited For | Reps, agents, coordinators | Managers, analysts, executives |
| Setup Time | Minutes | Minutes to hours depending on complexity |
The Core Philosophical Difference
Here is the simplest way to think about it:
List Views answer the question: "Which records do I need to work with right now?"
Reports answer the question: "What does my data tell me about performance, trends, and outcomes?"
List views are operational. Reports are analytical. Both are essential. Neither can fully replace the other.
When to Use List Views in Salesforce {#when-to-use-list-views}
List views are your daily driver. They are designed for the front-line Salesforce user who needs to move fast, stay organized, and take action on records without jumping through hoops.
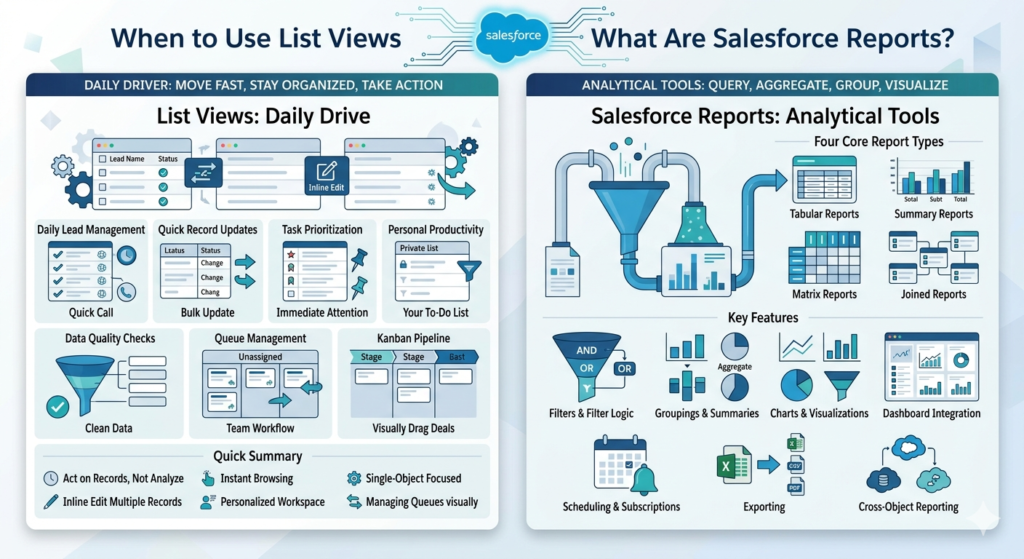
Here are the most practical, real-world scenarios where list views Salesforce features shine:
1. Daily Lead Management
A sales development rep (SDR) starts every morning by opening their "My Open Leads" list view. It shows them all uncontacted leads assigned to them, sorted by creation date. They can quickly scan through, identify hot leads, and start calling — all from the same screen. No need to run a report. No need to export anything. Just act.
2. Quick Record Updates with Inline Editing
Your sales team just finished a big batch of discovery calls. The manager wants everyone to update the Lead Status field for all the leads they spoke with. Instead of opening each lead individually, reps use a filtered list view and inline edit the Status field directly in the table — dozens of records updated in minutes.
3. Task Prioritization for Support Teams
A customer support team creates a list view called "My High Priority Open Cases" that filters cases by owner, priority, and status. Agents pin this view as their default so every time they log in, they see exactly what needs immediate attention — no analysis required, just action.
4. Personal Productivity and Focus
Individual contributors love list views because they are personal. You can create a private list view that shows exactly your accounts, your tasks, your opportunities — filtered and sorted exactly how you need them. It is like building your own personalized to-do list inside Salesforce.
5. Quick Data Quality Checks
An admin wants to find all Contacts without an email address. A simple list view with the filter "Email equals blank" surfaces all the problem records instantly. The admin can then use inline editing to make corrections in bulk. Fast and efficient.
6. Queue Management
For service cloud organizations, queues are managed through list views. A support team lead monitors a "Support Queue" list view to see unassigned cases and quickly reassign them to available agents. Real-time, actionable, and zero-complexity.
7. Kanban Pipeline Management
Sales reps can switch their opportunity list view to Kanban mode and visually drag deals from one stage to another. This makes list views a lightweight visual management tool that competes with standalone Kanban apps — without ever leaving Salesforce.
Quick Summary — Use List Views When:
- You need to act on records, not just analyze them
- You want instant, real-time record browsing
- Your task is single-object focused
- You need to inline edit multiple records quickly
- You want a personalized, pinnable daily workspace
- You are managing queues or workflow stages visually
When to Use Salesforce Reports {#when-to-use-salesforce-reports}
Salesforce Reports are your analytical powerhouse. They are designed for situations where you need to understand data at scale, track performance over time, present insights to stakeholders, or feed information into dashboards and automated alerts.
Here are the scenarios where Salesforce reporting is the clear winner:
1. Sales Pipeline Analysis
A sales manager needs to know the total value of all open opportunities, broken down by stage and by rep. A summary report grouped by Stage and Owner gives them a clean view of the entire pipeline — who owns what, how much is in each stage, and where the deals are getting stuck. No list view can do this.
2. Management Dashboards and Executive Visibility
The VP of Sales has a Friday ritual: reviewing the executive dashboard before the leadership call. This dashboard pulls from six different reports — pipeline health, win rate, average deal size, lead conversion rate, and monthly revenue trend. None of this is possible with list views. Salesforce reporting and dashboards are purpose-built for this.
3. Sales Forecasting
Forecasting requires comparing committed amounts to quota, tracking historical close rates by rep or territory, and projecting future revenue. A matrix report comparing rep forecasts across months gives the forecast manager exactly what they need to make confident predictions.
4. KPI Tracking and Goal Measurement
An operations team tracks a set of KPIs every week: number of new leads created, conversion rate, average response time, and case volume. Each KPI has its own report that feeds into a shared team dashboard. When a KPI drops below a threshold, an alert is triggered via a report subscription. Automated, scalable, and powerful.
5. Team Performance Reviews
During quarterly business reviews (QBRs), sales managers present each rep's performance. Reports showing closed revenue, win rate, average deal size, and activity volume per rep are pulled directly from Salesforce. A matrix report makes it easy to compare performance across the entire team in a single view.
6. Marketing ROI and Lead Source Analysis
The marketing team wants to know which lead sources are generating the most revenue — not just the most leads. A cross-object report connecting Leads → Opportunities → Revenue with grouping by Lead Source gives them the ROI breakdown they need to make smarter budget decisions.
7. Compliance and Audit Reporting
For regulated industries, compliance teams need audit trails — which records were created by whom, what changes were made, and when. Scheduled reports can be automatically emailed to compliance officers on a weekly basis, ensuring consistent oversight.
8. Scheduled Reporting for Leadership
The CEO wants a weekly email summary of key business metrics every Monday morning at 7 AM. A scheduled report does this automatically, without anyone having to manually run and email reports. Set it up once and let Salesforce handle the rest.
Quick Summary — Use Salesforce Reports When:
- You need to aggregate, group, or calculate data
- You are tracking trends over time
- You need to share insights across the organization
- Your analysis spans multiple objects or relationships
- You need dashboard integration for executive visibility
- You want scheduled delivery or automated alerts
- You are preparing for business reviews, forecasts, or presentations
- You need to export data to Excel or PDF
Pros and Cons {#pros-and-cons}
List Views Salesforce: Pros and Cons
✅ Pros
- Extremely fast to create — Set up a useful list view in under two minutes
- Inline editing — Update multiple records without opening them individually
- Real-time and always current — Data refreshes automatically
- Personalized and pinnable — Each user can create their own private views
- Kanban integration — Visual workflow management built-in
- Zero learning curve — Even the most non-technical users get it immediately
- Lightweight performance — No heavy data processing
- Great for action — Designed to be worked, not just read
❌ Cons
- No aggregation or summaries — Cannot calculate totals, averages, or counts
- Single-object limitation — Cannot combine data from multiple related objects easily
- No chart or visualization options (beyond Kanban)
- Cannot be added to dashboards
- Cannot be scheduled or automated
- Limited export options — No native Excel or PDF export
- Not suitable for trend analysis or historical comparisons
- Sharing at scale can get messy without governance
Salesforce Reporting: Pros and Cons
✅ Pros
- Powerful aggregation — Sum, Count, Average, Min, Max across thousands of records
- Multi-level grouping — Analyze data across multiple dimensions simultaneously
- Rich visualizations — Charts, graphs, and dashboards out of the box
- Dashboard integration — The foundation of every Salesforce dashboard
- Scheduling and subscriptions — Automated delivery to stakeholders
- Cross-object reporting — Analyze relationships between objects (Leads + Opportunities, Accounts + Cases, etc.)
- Export to Excel, CSV, PDF — Easy to share outside of Salesforce
- Advanced filter logic — Precise data segmentation with cross-filters
- Scalable — Works for 10 records or 10 million records
❌ Cons
- Steeper learning curve — Matrix and joined reports can be complex to build
- Cannot inline edit records — Reports are read-only
- Slower for quick daily tasks — Overkill for simple record browsing
- Report folder management — Can become disorganized without governance
- Performance impact — Very large or complex reports can take time to run
- Requires a Report Type — New users can get confused by report type selection
- Sharing and permission complexity — Folder-based sharing can be tricky for admins
- No live interactivity — You cannot act on records directly from a report
Common Mistakes Users Make {#common-mistakes}
Even experienced Salesforce users fall into these traps. Knowing about them in advance will save you hours of frustration.
Mistake 1: Using Reports for Simple Daily Tasks
A sales rep spends 15 minutes every morning running a report to see their open leads. The same result could be achieved with a pinned list view that loads instantly. Reports are not designed to replace list views for record browsing. Using them this way is like using a chainsaw to butter toast.
Mistake 2: Over-Relying on List Views for Analytics
On the flip side, many front-line users try to "analyze" data using list views — manually counting records, eyeballing totals, or scrolling through hundreds of rows to spot trends. This is exhausting, error-prone, and unnecessary. If you find yourself counting or calculating anything manually in a list view, you need a report.
Mistake 3: Poor Filter Setup on Both Tools
A list view or report is only as good as its filters. Common filter mistakes include:
- Date filters that are too broad — Showing "All Time" data when you only need "This Quarter"
- Missing ownership filters — Reports that show all users' data when they should be filtered to "My Records"
- Outdated filters — List views built for a campaign that ended months ago but are still being used
- No filter logic — Forgetting that multiple filters default to AND logic, when OR logic might be needed
Mistake 4: Ignoring Permissions and Visibility
A common admin headache: someone builds a critical list view as "Private" when it should be shared with a team — or worse, shares sensitive report data with all users when it should be restricted. Always think about who should see what before building or sharing.
Mistake 5: Building Reports Instead of Using Existing Ones
Most Salesforce orgs have dozens (sometimes hundreds) of existing reports. Before building a new one from scratch, always check if a similar report already exists. Report folder sprawl is a real problem that slows down the entire organization.
Mistake 6: Not Using Salesforce Reporting for Dashboard Building
Many users build beautiful dashboards and then wonder why the components look generic or unhelpful. The issue is usually the underlying report. Garbage in, garbage out. Taking the time to build a well-structured summary or matrix report makes your dashboards dramatically more powerful.
Mistake 7: Confusing List Views with Global Search
Some beginners use the global search bar to "search" for records every time, when a properly configured list view would give them the same records instantly every day. Global search is for finding specific records. List views are for surfacing groups of records consistently.
Best Practices {#best-practices}
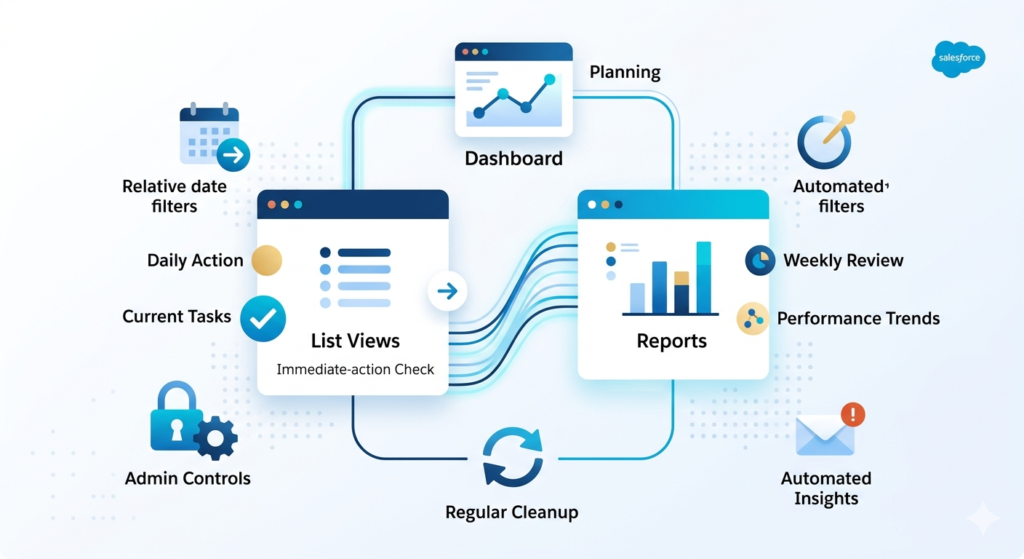
1. Use List Views and Reports Together as a System
The most productive Salesforce users do not choose between list views and reports — they use both in a complementary workflow:
- Start the day with a pinned list view to see what needs immediate action
- End the week with a report to review performance and identify patterns
- Plan the next month with a dashboard built from scheduled reports
Think of it as: List views for doing. Reports for thinking.
2. Establish Naming Conventions
Naming conventions make both list views and reports far more manageable at scale. Consider a standard format:
For List Views:[Object] - [Audience/Filter Description]
Example: Leads - My Open Uncontacted or Cases - Team High Priority Open
For Reports:[Object/Topic] - [Time Period] - [Owner/Audience]
Example: Opportunities - Q3 Pipeline by Stage - Sales Team or Cases - Monthly Volume - Support Team
Clear names prevent duplication, help users find what they need, and make org cleanup much easier.
3. Optimize Filters for Performance
- Always use relative date filters (like "This Quarter" or "Last 30 Days") instead of hardcoded date ranges so your views and reports stay relevant without maintenance
- Apply ownership filters to keep individual users' views focused on their own data
- Use cross-filters in reports to find records that have (or do not have) related records — this is a powerful feature most users overlook
4. Build a Dashboard Strategy Before Building Reports
Before creating a single report, sit down and answer these questions:
- Who will consume this data?
- What decision does this data need to support?
- How often should this data be reviewed?
- Does a report or a list view better serve this need?
This dashboard-first thinking prevents the creation of reports that nobody uses.
5. Audit and Clean Up Regularly
Set a calendar reminder every quarter to review your org's list views and reports:
- Delete list views that are no longer relevant
- Archive or delete old reports from campaigns or projects that have ended
- Consolidate duplicate reports
- Update filters to reflect current business rules
A clean, well-organized Reports folder is one of the hallmarks of a mature, well-governed Salesforce org.
6. Leverage Report Subscriptions for Automated Insights
If you have a key report that stakeholders need to review regularly, set up a report subscription so it lands in their email on a schedule. This removes the burden of remembering to check Salesforce and keeps leadership informed automatically.
7. Train End Users on the Right Tool for the Right Job
If you are a Salesforce admin, one of the highest-value things you can do is run a short training session explaining when to use list views vs reports. A 30-minute session can save your entire organization hours of inefficiency every week.
Conclusion: Choosing the Right Tool Every Time
The debate around Salesforce list views vs reports ultimately comes down to one simple question: What are you trying to accomplish right now?
If you need to see, sort, and act on a specific group of records as part of your daily workflow — build a list view. Make it smart with targeted filters, pin it for fast access, and use inline editing to update records at lightning speed.
If you need to understand, analyze, and communicate what your data is telling you — build a report. Group it thoughtfully, visualize it clearly, add it to a dashboard, and schedule it to reach the right stakeholders automatically.
The professionals who master both tools — and more importantly, master the judgment of knowing which one to reach for — are the ones who get more done, help their teams perform better, and deliver more value to their organizations through Salesforce.
Neither tool is inherently superior. Both are extraordinarily powerful when used correctly. Together, they form the backbone of a truly productive, insight-driven Salesforce experience.
About RizeX Labs
At RizeX Labs, we specialize in delivering practical Salesforce training and implementation expertise that helps professionals and businesses maximize CRM productivity. Our deep understanding of Salesforce administration, reporting, automation, and real-world workflows enables us to simplify complex Salesforce concepts into actionable strategies.
We empower Salesforce users to make smarter decisions by mastering platform features—from daily productivity tools like List Views to advanced Salesforce Reporting capabilities that drive business intelligence and operational efficiency.
Internal Linking Opportunities:
- Link to your Salesforce course page
- How to Build a Salesforce Portfolio That Gets You Hired (With Project Ideas)
- Salesforce Admin vs Developer: Which Career Path is Right for You in 2026?
- Wealth Management App in Financial Services Cloud
- Salesforce Admin And Development training
External Linking Opportunities:
- Salesforce official website
- Salesforce Reports & Dashboards documentation
- Salesforce List Views documentation
- Salesforce Trailhead (Reports & Dashboards)
- Salesforce Admin Guide
- Salesforce productivity tools overview
Quick Summary
Understanding Salesforce List Views vs Reports is essential for improving productivity, visibility, and decision-making within Salesforce. While List Views Salesforce features are ideal for quick access, personal productivity, and daily record management, Salesforce Reporting provides deeper analytical insights, trend tracking, and dashboard-ready data for managers and leadership teams.
By choosing the right tool for the right scenario, businesses can streamline daily operations, reduce inefficiencies, and unlock the full power of Salesforce for both execution and strategy. Mastering when to use List Views versus Reports ensures users work smarter, faster, and more effectively across sales, service, and operations teams.